- Step 1: Scope out your needs
- Step 2: Map out your tech stack
- Step 3: Set up the right data infrastructure
- Step 4: Set up metrics
- Step 5: Putting your data to work
- Step 6: Other features to consider
- What’s next?
Previously, we discussed the buzz around “PLG CRM” and what a next-generation sales tool for product-led growth companies might look like. To recap, here are some examples of what a PLG sales tool could accomplish:
- Take in product usage data as well as data from other key sources (e.g., CRMs, billing systems)
- Visualize such data to prioritize which users and accounts to reach out to
- Determine product usage journeys for different users over time
- Highlight key moments that trigger conversion
- Provide next best actions such as in-app notifications via Amplitude, or in-app chat via Drift
With no incumbents in the PLG sales tooling space, many companies are considering building a tool internally. Advice on doing so, however, is scant. In this article, we lay out a DIY approach for PLG CRM.
Step 1: Scope out your needs
Before whipping out your IDE and adding this project to your engineering kanban, it’s important to first align on what exactly you are building, and for whom.
Below are typical stakeholders who might have a use for such a tool. Bear in mind that in PLG companies today, revenue roles such as sales, success, and growth increasingly bleed into one another. For example, Snowflake has removed its customer success function entirely, instead directing its sellers to focus on increasing consumption.
Potential stakeholders:
- CEO/CRO, especially at earlier-stage startups
- Sales Ops or Revenue Ops
- Revenue leaders (Sales, Customer Success, Growth)
- End users: Sales reps (Account Executives and Sales Development Reps), Customer Success Managers, Growth Managers, Support or Operations Staff
Although the list of potential end-users is long, we suggest focusing initially on one or two stakeholders to build for. This helps you truly solve a narrow set of needs that you can expand down the road as opposed to boiling the ocean and having many unsatisfied stakeholders. You should choose a team that would gain the most unmet value and provide highest business impact. While this is usually the sales team, that may not always be the case depending on the specific needs of your organization.
After narrowing down the stakeholders, align on the key pain points and corresponding features that are ‘must-haves’ for initial version of the solution.
Here are key questions to help you identify the features you should build initially:
- What are the key business outcomes sellers are incentivized to pursue? (e.g., conversion from free to paid, expansion in number of seats)
- What are the key usage metrics that sellers will want to see for each user? (e.g., volume of API calls, number of integrations added)
- What are the key usage patterns that predict the business outcome you are looking for? (One such pattern might be if a user is on track to exceed their allowance of API calls for the month, that indicates they might be open to converting to a more premium tier.)
- What other types of contextual data does the stakeholder need to make decisions? (e.g., CRM, billing, demographic data)
- What sources would you need to collect data from?
- How would your sellers like to prioritize their users and accounts? Will they mainly rely on one metric or a weighted combination of several metrics?
- Would your reps need push notifications to identify key moments, and where would they like to see these notifications (e.g., Salesforce, Slack)
Answering these questions will give you a good idea of what version 1 of your tool should look like, and the key features that will deliver the most value.
Step 2: Map out your tech stack
Next, you need to survey your current tooling and data stack. This helps you understand where to pull data from, how to process that data, and what to do with the output.
Here are some tools that are typically employed:
Common sources of data
- *Product usage data: Segment, Heap, PostHog, Amplitude
- Billing data: Stripe, PayPal
- CRM data: Salesforce, Hubspot
- Demographic and firmographic data: Clearbit, ZoomInfo
Tools for storing and processing data
- *Collecting event data: Segment, Heap, PostHog
- *Cloud Data Warehouse: Amazon Redshift, Google BigQuery, Snowflake
- ETL: Fivetran, Stitch, Airbyte
- Transformation: dbt
- Reverse ETL: Hightouch, Census
Tools to visualise or surface outputs
- Work chat: Slack
- CRMs: Salesforce, Hubspot
- Business Intelligence: Looker, Tableau
*Essential tool stack
Understanding your current stack will help you know:
- What infrastructure you have that supports setting this up and what gaps remain. If you are missing any of the essential tooling listed, you should set them up or making the necessary infrastructural changes before starting.
- Which sources to pull data from when centralizing it (in the next step).
- Which tools to build integrations to push your insights and data into, such as CRMs (step 4).
Step 3: Set up the right data infrastructure
Centralize customer data in a data warehouse
The first step is to centralize all your data in a data warehouse such as Snowflake to make analysis and operations easy. The easiest way is to work with companies such as Prequel or Mozart Data. They provide a layer on top of data warehouse and ETL tools, making it easy to centralize all your data in a warehouse. Alternatively, you can use turnkey ETL solutions like Fivetran or Airbyte (open-source) and provision your own data warehouse directly with Amazon Web Services, Google Cloud Platform, or Snowflake.
Map different records of user data together
One oft-overlooked step is the need to map different tables of data about the same customer together—for example, the Salesforce account to the workspace or team in product data. We often see companies struggle with this step because data across multiple silos are often not standardized. For example, a user might sign up for your product and name their workspace or company “Acme” but a seller might create an account in Salesforce called “Acme Corp.”
To attack this problem, here are four main steps that you should take:
1. De-duplication
- Your lists of customers in the CRM, in the product, and other systems should be de-duped first before trying to map records from different systems together.
2. Resolve name mismatches
- The best approach we’ve seen here involves exporting a list of users or accounts in the product and in the CRM. Then, you’ll want to pull engineering or data science resources to run a fuzzy match against the two lists as a first pass at identifying and correcting name mismatches. After a fuzzy match, though, you’ll want to take the time to manually verify matched similar names to ensure records are not incorrectly linked together.
3. Implement a common ID
- The best way to ensure consistency going forward is to implement a consistent identifier across different systems. For example, you can create a product database ID of an account as a custom field on the Salesforce account object or just use the Salesforce account ID.
- You could then simply have someone copy the ID from one system to the other for each new account that’s created. The most savvy companies solve this problem using internal scripts to sync a consistent ID across the different systems, e.g., the script would immediately create a new account in Salesforce when a user signs up for the product; the product database ID is also automatically included in the process.
- You’ll want this consistent ID across all your sources of customer data including product usage data, CRM, billing, and support systems.
4. Mapping users to accounts
- Finally, you’ll have to align each user to the appropriate company. This is especially important for products where many users can be found in one company (e.g., Slack, Notion, Miro). The mapping process is more straightforward here because the majority of users sign up with their company email. However, this step still often involves a great deal of manual work to correct for typos, different versions of company emails, and users who sign up with their personal email.
- We typically find using the domain of email addresses to be the best way to group users into accounts.
Step 4: Set up metrics
Based on step 1, you should have a good idea of what kinds of metrics might be important to surface to your reps. The best approach is to then materialize these metrics in your data warehouse using a transformation tool like dbt so they can be used by many different tools. We will walk through one example here.
For example, if you are a data storage company, you might be interested in the total size of files uploaded over the last 30 days. This can indicate if a user is more or less engaged, or even whether they are likely to exceed the allowance within their current package. All this might suggest an opportunity to pitch the user to convert to a higher tier.
For this, you would want to materialize a rollup table with each row representing a user or an account and the columns containing:
- User or account ID
- Common identifier that exists for this user or account across all systems including Salesforce
- Total size of files uploaded over the last 30 days
The hard part is writing the SQL query to wrangle data from event or application database tables to compute the total size of files uploaded. Once you have the views defined, you’ll want to run the transformations on a schedule, for example, with Airflow, so that they stay up-to-date.
Step 5: Putting your data to work
Congratulations, you are now at the exciting bit—getting actual outputs into the hands of your revenue teams!
Visualizing the output
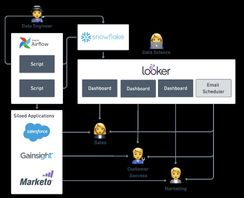
One common set-up we have seen is to create interactive Looker or Tableau dashboards. Your sales team might be unable to write SQL queries, so interactive dashboards can help strike the balance between the ability to configure and ease of use. These dashboards might show the usage of a certain feature broken down across key accounts over time. Or, they may highlight which small accounts have high growth potential by also taking into account firmographic data such as whether they raise significant funding recently.
The downside to this method is that it can be hard to get sellers to build a habit around using BI tools. There is also a lot of training and change management to get new users onboarded to these tools, not to mention the cost of adding seats.
Enriching your existing sales tools with product data
You might also wish to present the data directly in your CRM or other revenue tools (e.g., Gainsight, Marketo). The advantage of this is that your Sales, Customer Success, and Marketing teams won’t have to learn a new tool and toggle between tabs. On the other hand, tools like Salesforce are not great at handling large volumes of data, and you will have to test the implementation to make sure it is not too slow.
If you do choose to sync metrics into CRMs and other revenue tools, you can set up a script to write data into the CRM, for example using the Salesforce Bulk API, and running the script on a schedule with Airflow. Alternatively, you can use an off-the-shelf reverse ETL tool such as Hightouch or Census.
Setting up an internal tool
If you choose to build your own UI to consume this data, you will likely want to enable export of the data into a CSV file. Many sellers at PLG companies who have such internal tooling often export the data into Excel to conduct their own pivots and analyses. For example, reps who cover territories with more fragmented, smaller companies, might be interested in spotting growth in usage. In contrast, reps serving larger companies might be focused on finding users who are connected to a lot of their colleagues, since they are potential champions within the organization.
Setting up notifications
Revenue teams often want to be alerted of key moments. For example, is a user completing an action that indicates the likelihood of churning, such as removing billing information or uninstalling an SDK? Or perhaps they have exhibited behavior your data teams have identified as an indicator for willingness to pay for a more premium product. One example that we saw in a PLG company was if a user used the tool for a consecutive 3 day period within the first 14 days of activation.
Folks who are users of BI tools like Metabase or Looker can set up email and Slack alerts inside those tools themselves as long as they have access to their Slack API token. With these tools, you can probably satisfy fairly simple use cases. For example, when a usage metric reaches a certain threshold, your sellers will receive an alert to Slack.
Those who are looking for something more extensible and robust can try utilizing Integration platforms-as-a-service (iPaaS) like Zapier or Workato. These iPaaS provide a way of connecting the database/data warehouse with Slack/email by automating the process of searching for rows in the data sets that matches a custom query defined in your iPaaS.
What it should look like when it comes together:
Step 6: Other features to consider
Recommending next best actions
One PLG company we spoke to built the ability for the sales and support reps to note down ‘plays’ that were effective for a particular type of customer, in a particular context. One example might be if a customer was not using the product after activation, the rep might offer the customer a 30 day free trial via email to remind them to engage. These ‘plays’ were then collected in a library where they could be reviewed by other reps.
Over time, the RevOps team became more confident in which play to deploy in each situation. They could then automatically suggest plays to reps if a certain set of behaviors were observed for a particular user profile.
Machine learning to identify new triggers
Many revenue teams have inklings on what type of usage patterns and demographic traits to care about. But most companies we spoke to feel they have yet to tap into the goldmine of data they are collecting. “There are certainly leading indications of buying intent in the data that we have not yet uncovered or institutionalized,” remarked the head of sales at a PLG unicorn we talked to.
Personalization engines and user behavior tracking are often table stakes in consumer tech. There is still tremendous value to be captured in B2B software by augmenting revenue teams with intelligence. You might realize that users hailing from a certain geography, or working in a certain function, demonstrate different behaviors within your app when they are engaged, or when they are dissatisfied.
We see growth and operations teams tease these out by manually comparing cohorts of users across various dimensions until they find the dimensions and threshold or values within those dimensions that sharply differentiate a cohort of successful vs. unsuccessful users. This analysis is typically done by writing SQL queries to pull data and then analyze cohorts visually and by conversion metrics across the different dimensions.
What’s next?
Setting up a system like this can be really powerful. Top product-led companies with a very deep data and engineering talent pool (looking at you, Dropbox) have built this internally, to great success. The sellers were able to leverage data to increase their productivity by more than 200%, with sellers covering territories in the range of tens of thousands of accounts.
That said, building is also incredibly complicated. Your data and engineering teams are better suited focused on building your product. At HeadsUp, we are building a tool that does all of this for your revenue teams.
What’s more, we are taking the best learnings from working with the top PLG companies to sharpen our point of view. We’ll have insights into which metrics to track and what are the best ways to engage, for each type of customer. If you’re interested, shoot us a message at hello@headsup.ai!
Business illustrations by Storyset

